Image Annotation Tool
🌄 Guide to annotating Image data
Guides on BasicAI's powerful image annotation tool, providing object detection, tracking, segmentation, and more functionalities.
Prerequisites
Before starting the annotation process, it is essential for you (or your project manager) to upload a dataset and configure the ontology.
📖 Click to view quick steps
1️⃣ Create aDataset or Task with the type of Image and upload data.
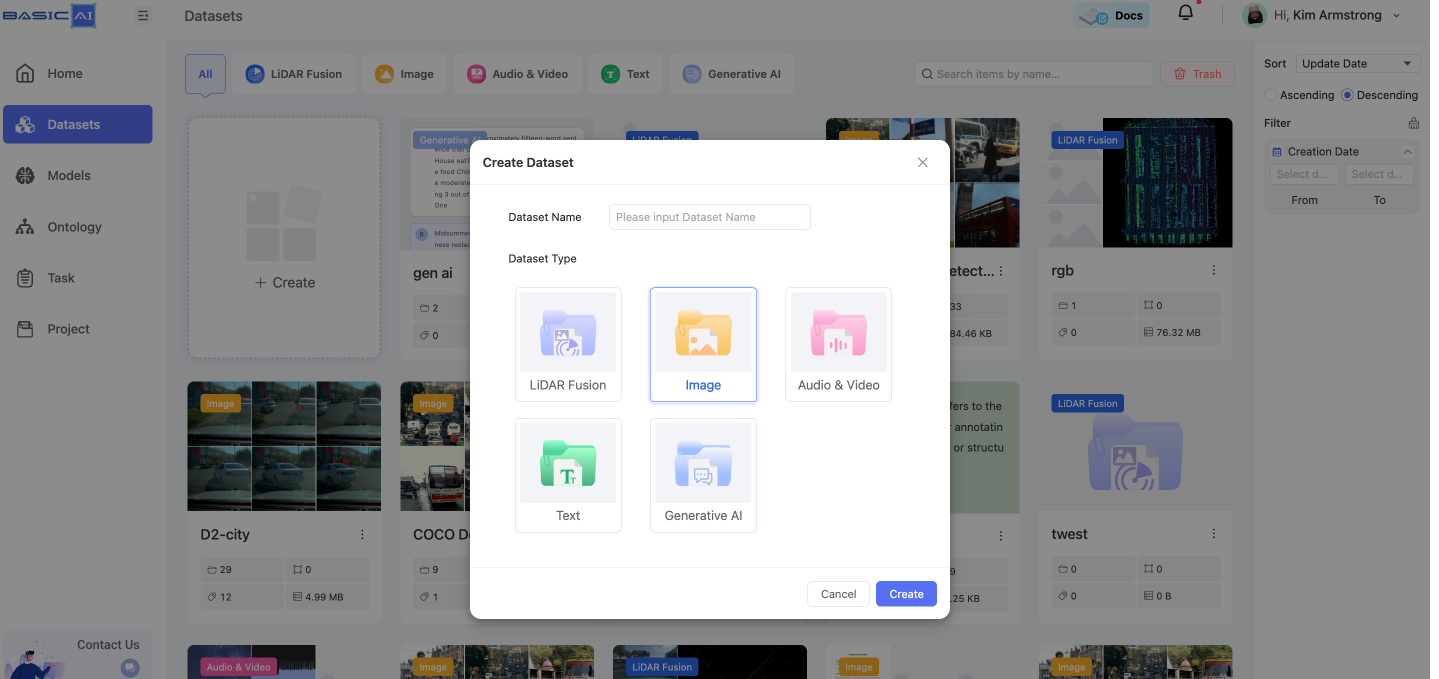
At present, BasicAI supports uploading data in the following formats:
- Image files:
.jpg/.jpeg/.png/.bmp/.tiff/.webp - Video files:
.mp4/.mov/.mkv/.avi - Compressed files:
.zip/.gzip/.tar/.rar
For further details on supported formats and upload configurations, please navigate to Upload Data.
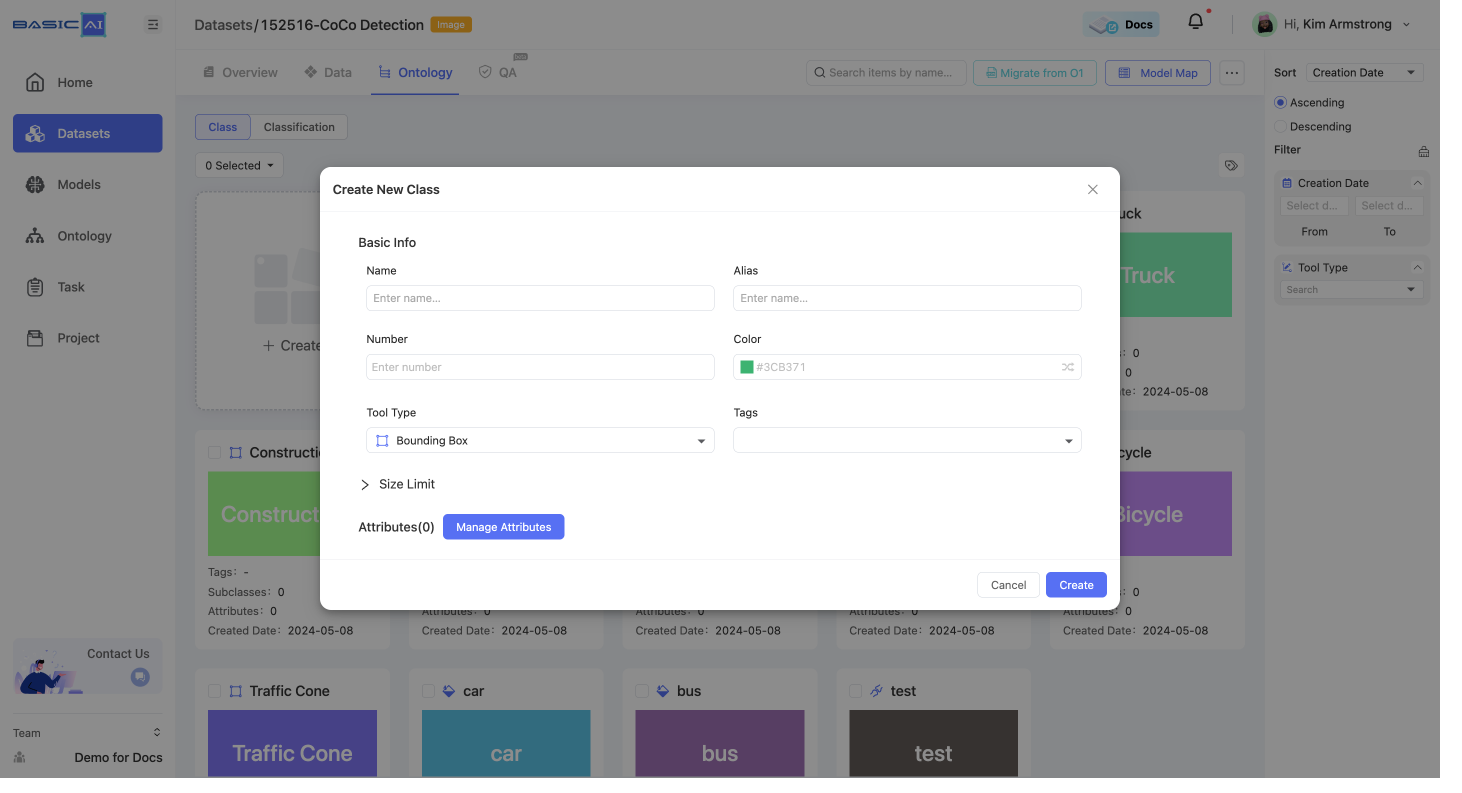
2️⃣ Configure the Ontology based on task requirements.
After creating the dataset and uploading data, click the Ontology tab to configure its classes, attributes, and classifications. For further details, please click Ontology. Explanations of the tool types can be found in the Ontology Tool Type guide.
Video Tutorial
Interface
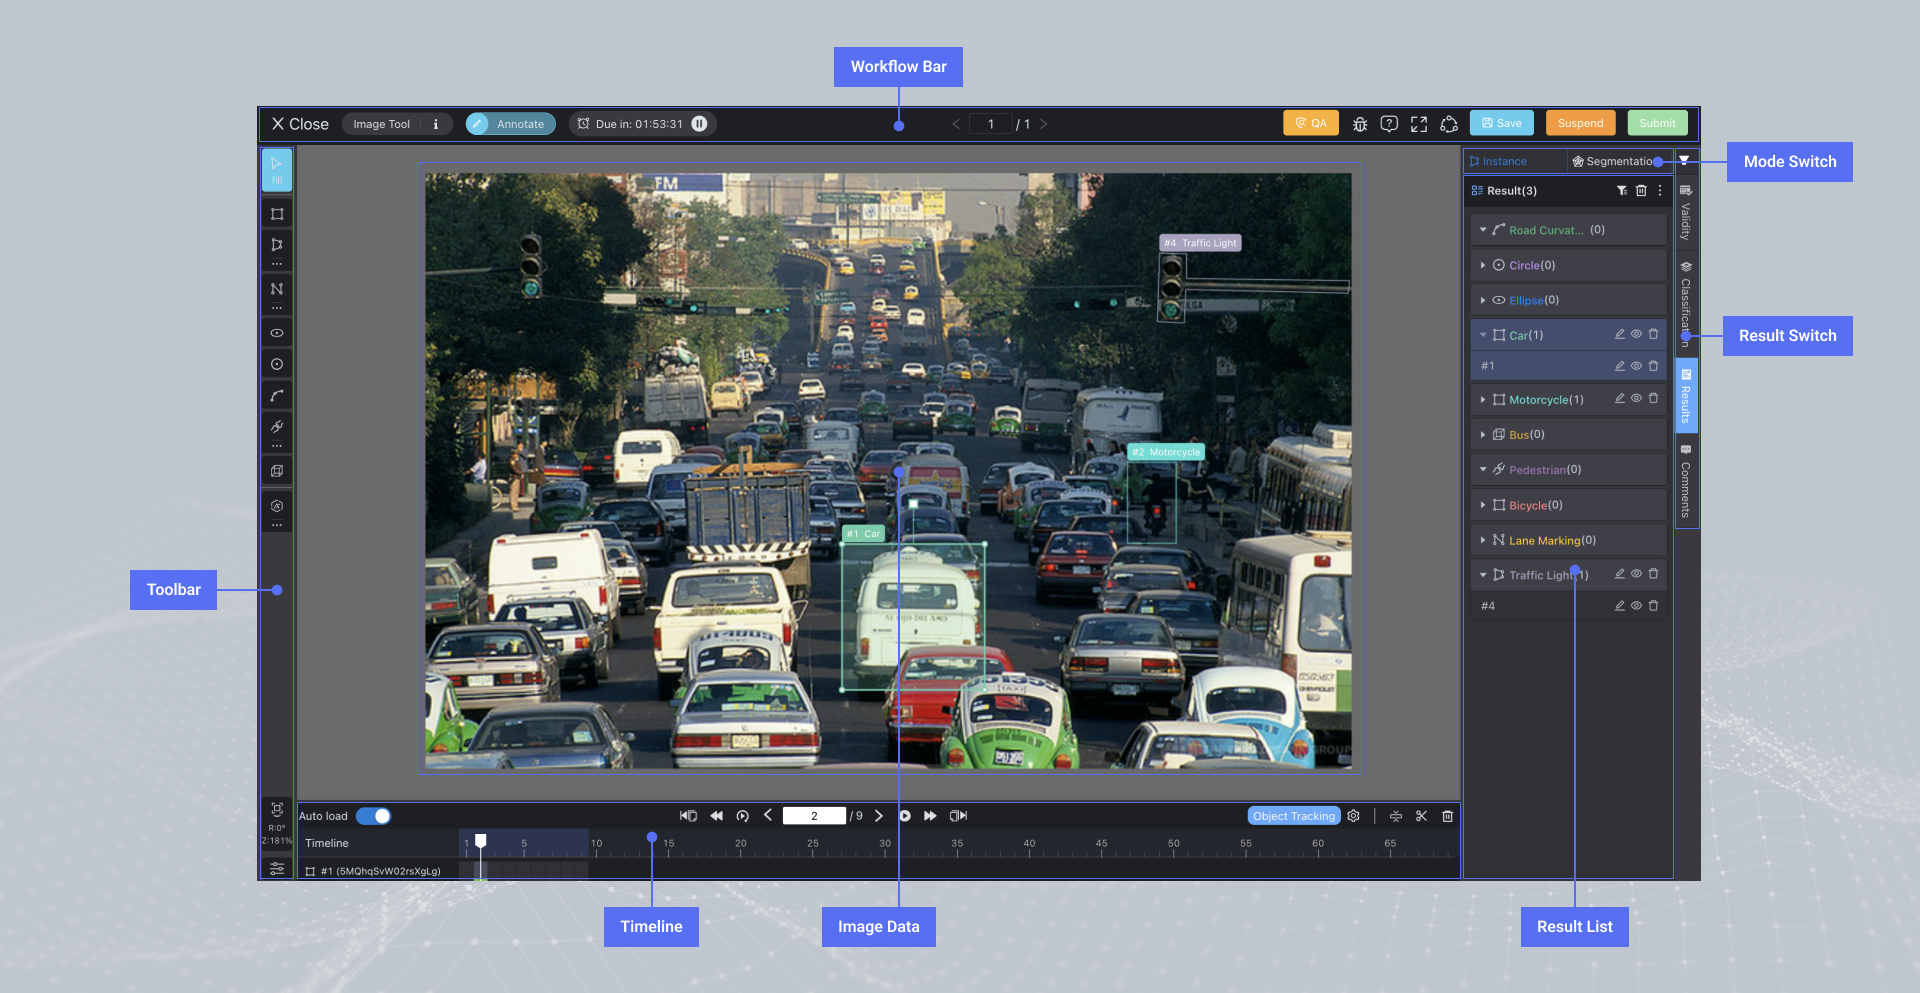
The Image Tool interface consists of various sections:
- Workflow Bar: For viewing basic data info and performing task-related operations. See more details.
- Image Data: Images from camera sensors; served as a 2D canvas for detecting & tracking objects, and segmentation.
- Toolbar: Providing various annotation tools and result display settings.
- Timeline: For managing frames in the scene and object tracking.
- Mode Switch: For toggling between Instance and Segmentation annotation modes.
- Result Switch: For switching between Results, Classifications, Validity, and Comments lists. See more details.
- Result List: Displaying annotation results for efficient management.
NOTICE:For each task, these areas may vary based on the Annotation Type (Instance/Segmentation) and Scenario Type (Single Data/Scene) designated by the Project Manager.
We will explore them further in the detailed pages.
Canvas Transforms
- Translation: 🖱️Right click and hold to drag the canvas.
- Scaling: Scroll the mouse wheel up/down to zoom in/out.
- Selection: 🖱️Left click on results to select them. Once selected, the focus will automatically be on the result.
- Relocation: Press the hotkey Z to reset the canvas position.
Display Settings
For better image and result display, you can click the icon in the bottom left corner to open the settings panel.
- Image Settings: You can enable the Image Smoothing button to make the image look smoother or adjust the brightness, contrast values, and pixel precisions.
- Result Settings: It provides multiple setting options, such as adjusting opacity, border width, and default result color, as well as showing size, class, single/group result, etc.
- Comment Setting: You can choose to show comments or not.
- Other Settings: You can enable the buttons of measure line, measure tools, or bisector to add these auxiliary tools to the drawing canvas. In terms of the Display Mode,
Maskmeans showing fully filled results, whileMarkmeans showing border results; both the results ofMaskandMarkcan be hovered on for semi-transparent filling.
Updated about 1 year ago